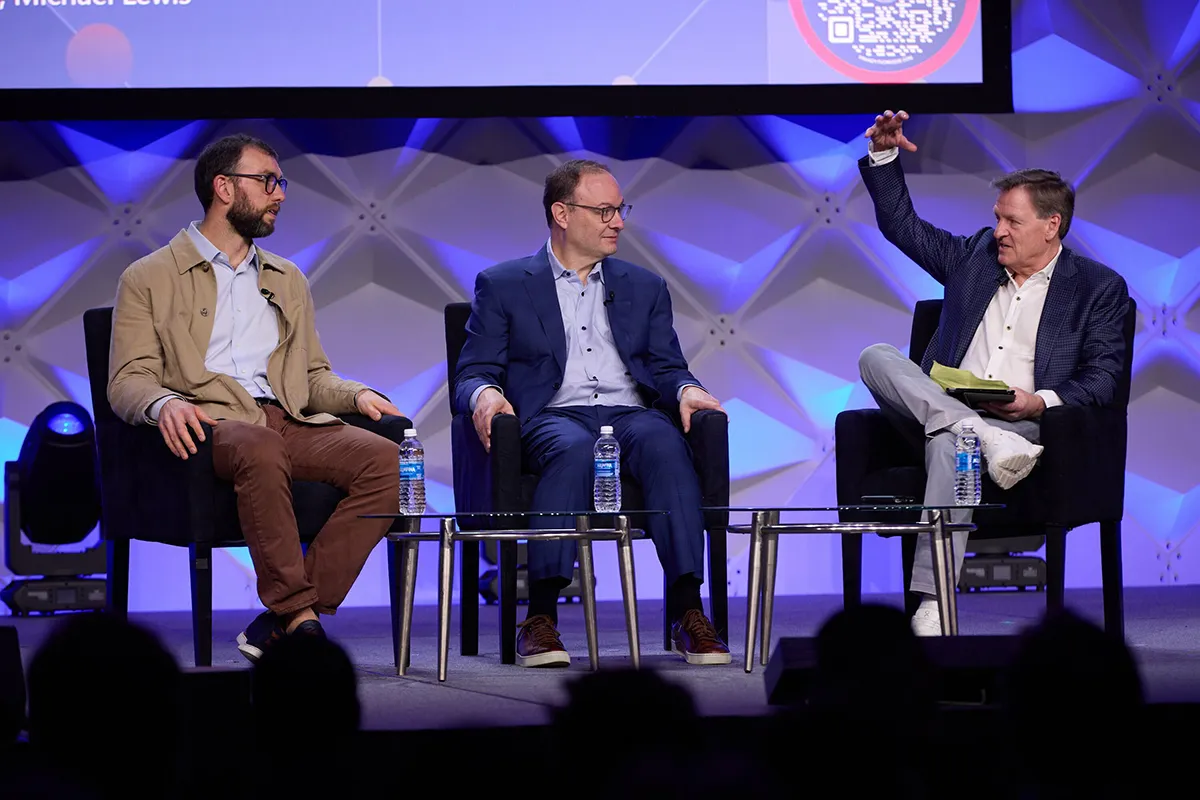
SSAC Blog sponsored by

Blog

BrandMatchScore

A Recap and Thoughts on a Labor Negotiations Panel

MIT : March 19, 2013 11:00 am : Blog

By Justin Rogers, Senior Vice President, BrandMatch Score

On Friday March 1st and Saturday March 2nd, Boston’s Convention and Event Center hosted the renowned gathering of the sports industry’s top owners, executives, and next crop of sporting experts at the 7th Annual MIT’s Sloan Sports Analytics Conference.  Being our first time attending, we had heard how infinitely informative, educating, and productive the conference was.  Yet, now a full week removed, it still overwhelms the mind contemplating the sheer impressiveness of it and what the overall content theme means to the ever-changing landscape of the business of sports. more »

GoldmanRao

Putting the Team on Their Back? The Usage and Efficiency of NBA Superstars in Critical Situations

MIT : March 18, 2013 11:00 am : Blog

By Matthew Goldman, economics Ph.D. student at the University of California-San Diego and Justin M. Rao, Ph.D., economic researcher at Microsoft Research

Do star players “put the team on their back” in critical situations? While it’s relatively easy to remember a game winning shot, it can be hard to tell just how the offensive load is shifting over the course of the game. In this post we use 5 years of play-by-play data to answer this question quantitatively.

We examine how two key metrics of offensive performance vary across the game state, which we define with the current score margin and time remaining at the time of a shot. The first is “usage rate”: the fraction of possessions in which the player takes the team’s first shot. The second metric is “efficiency”: the number of points on a given possession in which the player took the first shot (note we include free-throws made if the player was fouled and points scored off an offensive rebound). more »

JoePeta

Weekend in New England; The 2013 Sloan Conference

MIT : March 7, 2013 11:50 am : Blog

By Joe Peta, Author of Trading Bases, A Story About Wall Street, Gambling, and Baseball

During his time as head coach of the Green Bay Packers, Forrest Gregg one summer reported to training camp newly married. During a press conference, he was engaged in small talk with reporters when he was asked how he enjoyed the honeymoon. Ever the head coach, Gregg replied, “I won’t know until I review the film.”

After having given a thirty minute presentation at the Sloan Analytics Sports Conference this past weekend, I know just how he feels. more »

Screen Shot 2013-03-02 at 8.32.11 AM

Final Thoughts From The 2013 MIT Sloan Sports Analytics Conference

MIT : March 4, 2013 10:00 am : Blog

By Zach Slaton, Author of A Beautiful Numbers Game, Contributing Writer at Forbes

It’s 5:00 AM on Sunday, March 3rd.  I am sitting in Boston Logan International Airport waiting to board my plane back to Minneapolis, Minnesota, that will allow me to make my connecting flight to Seattle and all I can think of in no particular order is: more »

Screen Shot 2013-03-02 at 8.32.11 AM

Sloan Sports Analytics Conference: Day One Wrap Up

MIT : March 2, 2013 9:05 am : 2013, Blog

By Zach Slaton, Author of A Beautiful Numbers Game, Contributing Writer at Forbes

Five stages. 39 panels. 2700 attendees.  21,600 people hours.  All in the pursuit of the next great sports analytics breakthrough, and that is just the first of two days at the MIT Sloan Sports Analytics Conference.  My intention of describing the conference as the Super Bowl of sports analytics was to draw an analogy between the scale of the conference and it being the culmination of an academic calendar’s worth of research.  Day one lived up to those expectations and more. more »

Damien

Using Spatial Analytics to Study Spatio-temporal Patterns in Sport, by Damien Demaj, Geospatial Product Engineer at ESRI

MIT : February 25, 2013 10:24 am : Blog

By Damien Demaj, Cartographic Product Engineer at ESRI

Late last year I introduced ArcGIS users to sports analytics, an emerging and exciting field within the GIS industry. Using ArcGIS for sports analytics can be read here. Recently I expanded the work by using a number of spatial analysistools in ArcGIS to study the spatial variation of serve patterns from the London Olympics Gold Medal match played between Roger Federer and Andy Murray. In this blog I present results that suggest there is potential to better understand players serve tendencies using spatio-temporal analysis. more »

ssac_fb_thumb

Finalists Ready to Compete for 2013 SSAC First Pitch Competition Titles

MIT : February 22, 2013 4:28 pm : 2013, Blog

After months of hard work from MBA and Undergraduate teams across the country, the finalists for the 2013 Sloan Sports Analytics First Pitch Competition presented by MLB Advanced Media have been decided! The MBA teams have been working to develop strategies that will drive growth for the MLB.TV business model, while Undergraduate teams have been tasked with bringing digital products of the future to the MLB ballpark. Teams will present recommendations to a panel of business and industry leaders at the Sloan Sports Analytics Conference on Friday, March 1st. And the finalists are…

more »

alamar

Investing in Analytics

MIT : February 21, 2013 10:30 am : Blog

The following is an excerpt from the book Sports Analytics: A Guide for Coaches, Managers, and Other Decision Makers, by Benjamin Alamar, Professor of Sports Management at Menlo College.

Analytics includes advanced statistics, data management, data visualization, and several other fields. Because this list is ever changing, implementing an analytics program to gain a competitive advantage is not a straightforward process. Every sports organization faces its own set of challenges in introducing and developing analytics as part of the decision-making process, but understanding the components of an analytics program will help managers maximize the competitive advantage they can gain from their analytic investment. more »

Rajiv Blog

Defeating the Dead Ends of Data Analytics

MIT : February 20, 2013 2:39 am : 2013, Blog

The following guest blog post was written by Rajiv Maheswaran, Research Assistant Professor at the University of Southern California’s Computer Science Department.

It often begins with a question. Perhaps, it is wondering why something happened or curiosity about the relationship of one thing to another. We can ruminate, speculate, debate and finally let it dissipate. For many, that is enough, but for others, either by personality or profession, we need answers. So we start with “observations”, what we can see and record from the real world, and see if we can transform them in some way to give us what we believe is insight. In this way, sports is like science: hypothesize, predict, experiment, analyze, rinse, and repeat. It’s the “repeat” part that is the key yet is sometimes lost because analysis often leads to large piles of excrement, hence the rinsing.

This problem gets more difficult as the number of observations grow. The pioneers of sports analytics depended on box scores. For basketball, this meant hundreds of observations per game (field goal attempts, rebounds, technical fouls for finger wagging, etc.). Today, with optical tracking technology such as STATS’ SportVU, we can gather a million observations per game. This increases the number of dimensions from which we can construct theories. It opens up the possibilities of what we can discover at the cost of introducing many more ways to get lost. Last year, we made some discoveries using basketball optical tracking data that are summarized in the video below: more »

ESPN_stats_info

Behind the Scenes with ESPN Stats and Info for Super Bowl XLVII

MIT : February 14, 2013 10:00 am : 2013, Blog

The following guest blog post was written by John Parolin, Statistics Analyst, ESPN Stats and Analysis.

Like 108.4 million other Americans, the people of ESPN Stats and Information tuned in on Feb. 3 to watch the Baltimore Ravens hold off a late comeback from the San Francisco 49ers to win the Super Bowl. When the final seconds ticked off and the Ravens hoisted a second Lombardi Trophy, ESPN Stats and Info went to work. more »

baldie

Hockey Analytics: Derived Statistics are the Beginning not the End

MIT : February 5, 2013 11:54 pm : 2013, Blog

The following article was written by Kevin Mongeon, a principal owner at The Sports Analytics Institute that provides consulting advice to a number of professional hockey teams.

A large portion of the efforts of sports analytics specialists is focused on determining the value of a player, or more specifically, a player’s contribution to winning.  To this end, analysts have created a number of derived statistics that potentially determine a player’s contribution to winning more accurately than traditional statistics.

more »

twitter

#SSAChat13 Twitter Chat Recap 1/13/13: NBA & NFL Analytics

MIT : January 16, 2013 10:29 pm : 2013, Blog

Missed our Sloan Sports Analytics Conference Twitter Chat on Monday 1/13? Below are some of the NBA and NFL analytics related questions asked from Twitter and answered by our panel, which included:

Daryl Morey – General Manager of the Houston Rockets, @dmorey
Pablo Torre – Senior Writer, ESPN The Magazine, @pablotorre
Evan Silva – Writer, NBCSports.com & Senior Editor, Rotoworld.com, @evansilva

Another thank you to all of our panelists and followers for participating! more »

EdFeng

How to Make It In The Sports Analytics World

MIT : December 24, 2012 10:54 am : 2013, Blog

The following article was written by Ed Feng, Founder of ThePowerRank.com

Sports is a throbbing passion for so many of us.

The only thing better than watching from the couch is getting a job in the sports world. And with the growth of sports analytics, there is a new way for smart and ambitious people to break into this world. Since numbers now affect every aspect of sports from ticket sales to predicting game outcomes, the opportunities are everywhere.

Maybe you’ve even done your own calculation already, harnessing the glut of computing power on your laptop after work or school. It’s never been easier to say something meaningful about sports.

But getting noticed in the sports analytics world is more difficult. How do you transition from school or horrible day job to working full time in sports analytics? If you’re reading this blog, it has probably already occurred to you that attending the Sloan Sports Analytics Conference is a good idea.

But you haven’t thrown down your credit card just yet. Maybe it’s the hurdle of booking a flight or taking a day off from work. Or else it seems like a long shot to get noticed at a conference with over a thousand people.

You should come to this conference. Let me tell you a little story about why. more »

goldsberry

Catching up with Kirk Goldsberry, 2012 Research Paper Finalist!

MIT : December 13, 2012 10:03 pm : 2013, Blog

The SSAC blog team recently caught up with Kirk Goldsberry, last year’s runner up in the research paper competition.  You can check out his submission, “CourtVision: New Visual and Spatial Analytics for the NBA,” right here.

-        After the 2012 SSAC, what was the response to your research?

The response was great. In fact, the response was so favorable at the conference itself that I actually went home and launched my blog that night. It was really the first time that I had that amount of attention from the media. I took that as a sign that I might be on to something people are interested in. more »

loudepaoli

How MIT’s SSAC is Driving the Evolution of Sports Analytics

MIT : December 5, 2012 11:38 am : 2013, Blog

The following article was written by 2013 SSAC panelist Lou DePaoli, EVP and CMO of the Pittsburgh Pirates.

Like many other executives in the Sports and Media industries, the MIT Sloan Sports Analytics Conference (SSAC) is the highlight of my calendar every year. I feel it is hands down the best conference in our industry. Here are a couple of reasons why:

• SSAC is a “5-Tool Player”- it delivers the key elements that an ideal conference should offer: evolving and engaging topics, best-in-class speakers and presenters, valuable networking, excellent planning and logistics, all combined in a great setting.

• SSAC is a “Game Changer” – the impact this conference has had in how decisions get made in our industry, on and off the field, has been nothing short of revolutionary. Many of the topics that were presented, debated, and analyzed during the first six years of this conference have led to an evolution in analytics-based decision-making that is now utilized by most team’s front offices and has also become part of the lexicon used by broadcasters, writers, and fans.

more »

brianburke nfl stats

Fourth Downs in the New Overtime: First Possession

MIT : December 1, 2012 7:44 pm : 2013, Blog, Uncategorized

The following article was written by 2013 SSAC panelist Brian Burke for his blog Advanced NFL Stats and can be found here.

This may have been the most difficult, challenging analysis I’ve done. No joke. The new OT format is more complex than it seems. There are three distinct ‘game states’ in which a team can find itself:

1. The initial drive of the first possession (A TD wins, a turnover or punt triggers Sudden Death (SD), and a FG triggers State 2.)
2. The team down by 3 now has one possession to match the FG (triggering SD) or score a TD to win.
3. Sudden Death
more »

IPP WOWY Analysis of Crosby / Malkin and Thornton / Marleau

MIT : November 19, 2012 7:43 pm : 2013, Blog, Uncategorized

The following article was written by David Johnson at HockeyAnalysis.com on October 29, 2012 and can be found here. Thanks for sharing with us, David!

The other week I wrote about breaking down IPP (Individual Point Percentage, which is individual points divided by number of goals scored while the player was on the ice) into IGP (Individual Goal Percentage) and IFAP (Individual First Assist Percentage). It seems IGP does a decent job of identifying the pure goal scorers and IFAP does a decent job of identifying the pure play makers. I have always been interested in team/line makeup and how to maximize a lines performance so I decide to take a look at WOWY (With or Without You) IPP comparisons for two pairs of extremely talented players who have at times played together and at times played on separate lines the past 5 years. These are Crosby/Malkin and Thornton/Marleau. Let’s start with Crosby/Malkin. more »

katz&defelice

Welcome to the 2013 Sloan Sports Analytics Conference Blog!

MIT : November 9, 2012 5:30 pm : 2013, Blog

Hello and welcome from the SSAC Organizing Team!

We are incredibly excited to bring you this blog with fascinating and insightful sports analytics content.  Throughout the year, especially in the run-up to the 2013 Sloan Sports Analytics Conference, we will feature great posts from new and old contributors, student organizers, and innovators within the sports analytics community.  Here, we will examine all aspects of the industry from player and team evaluation to analyzing business practices.

We hope you enjoy all of the upcoming posts. And, if you have a great idea for a post and are interested in contributing to the blog, contact us at blog@mit.edu. We’d love to hear from you!

On behalf of the entire organzing team,

Jon Katz and Jordy DeFelice

Damien

Demaj: Using GIS Software for Sports Analytics

MIT : September 7, 2012 11:17 am : Blog

By Damien Demaj, Cartographic Product Engineer at ESRI

The statistical component of sport has always provided a fascinating way to analyze performance and success. This might simply be the final score, but for some sports, such as football, baseball, cricket, golf and tennis, meaningful analysis of every facet of the game and a player or team’s actions is part of the essence of the game itself. It is as common to see statistics and graphical summaries of the action reported as it is to see the action itself and this provides a fascinating insight into strategy as well as an explanation of outcome. In this blog entry we explore the results of the London Olympics Gold Medal tennis match between Roger Federer and Andy Murray to show how you can use GIS to identify particular patterns within the match that may not have been exposed by using traditional non-geographical analysis and display techniques. more »

millman

Millman: A New System To Bet College Football

MIT : August 15, 2012 12:04 pm : Blog

By Chad Millman, Editor in Chief of ESPN The Magazine

The following article appeared in Chad Millman’s ESPN Insider blog on August 10th and can be found on ESPN.com.

I met 27-year-old Mike Wohl at the MIT Sloan Sports Analytics Conference in March. He was the MBA graduate student coordinator for the panel I was on about the world of sports betting today. This was my second year appearing at the conference, and meeting the student liaisons is one of the highlights. more »

« Page 1 »